How to Add a Live Traffic Map to DAKboard
A few months ago, I came across a reddit post asking if there was a way to add live traffic conditions map to DAKboard. For those who are unfamiliar, “DAKboard is a customizable display for photos, calendar, news, weather and so much more!” It priced at a point where it’s reasonable for families to use as their family hub and many get away with the free plan.
I originally thought there was a way to do it with google but at the time DAKboard limited you to embedding iframes only and therefore your couldn’t run scripts as required by Google’s Static Maps API. There was a way to embed Bing Maps, but I personally prefer Google Maps.
Recently DAKboard added a widget (currently listed as beta) for HTML and JavaScript that allows users to add custom code to do a bit more than they could in the past, including adding Live Traffic Maps to your board! It’s worth noting that this widget is likely to be a premium widget requiring a paid plan; though, at the time of writing, the pricing page does not reflect that.
Below are the steps to add a Live Traffic Map to your dashboard.
1 - Get setup with the Google Cloud Platform
If you don’t already have an account with Google Cloud Platform, you’ll need to create one. You can use your standard Google Account to login and accept any terms. NOTE: you are required to put a credit card on file to create API keys and technically there is a fee to use the Google Maps APIs. I say technically because, as of this writing, you get $200 worth of monthly credits which should be more than enough to cover costs for personal use.
2 - Create a Project
If you’ve already created a project for DAKboard then I’d recommend using that one and just add services and APIs to it. If you don’t already have one, I’d recommend creating one specifically to use with DAKboard just to keep things clean. I won’t go into the details here, but Google provides a nice overview about Creating a Project.
3 - Enable APIs and Services.
From the APIs Dashboard on the Google Cloud Platform, you’ll need to enable some APIs and Services. From the dashboard there’s a link that says Enable APIs and services and takes you to the API Library. You’re looking for the Maps JavaScript API. You’ll need to enable that and accept some terms.
4 - Create an API key
Once the service is enabled, you need to create an API key to use with that service. You can use a single key to enable multiple services but I prefer to keep them distinct.
You can jump to the API Credentials page or navigate to it from the service dashboard or by clicking APIs > Maps JavaScript APIs (from the table) > Credentials (secondary nav) > Credentials in APIs & Services (link just below the secondary nav).
Click “+ Create Credentials” link at the top and select API Key. A key will be generated and you can copy it to the clipboard. It is recommended you restrict the API key to manage quotas and keep it secure.
When you restrict it, you are given the opportunity to name this particular key and I’d recommend something descriptive like “DAKboard Live Traffic Map.” I’d also restrict which API this key can call by choosing the “Restrict Key” option under API restrictions and checking the box for the Maps JavaScript API. You may also be able to restrict by application.
5 - Find your Latitude and Longitude
You can use Google Maps to find your latitude and longitude by searching for your desired location and looking at the URL;
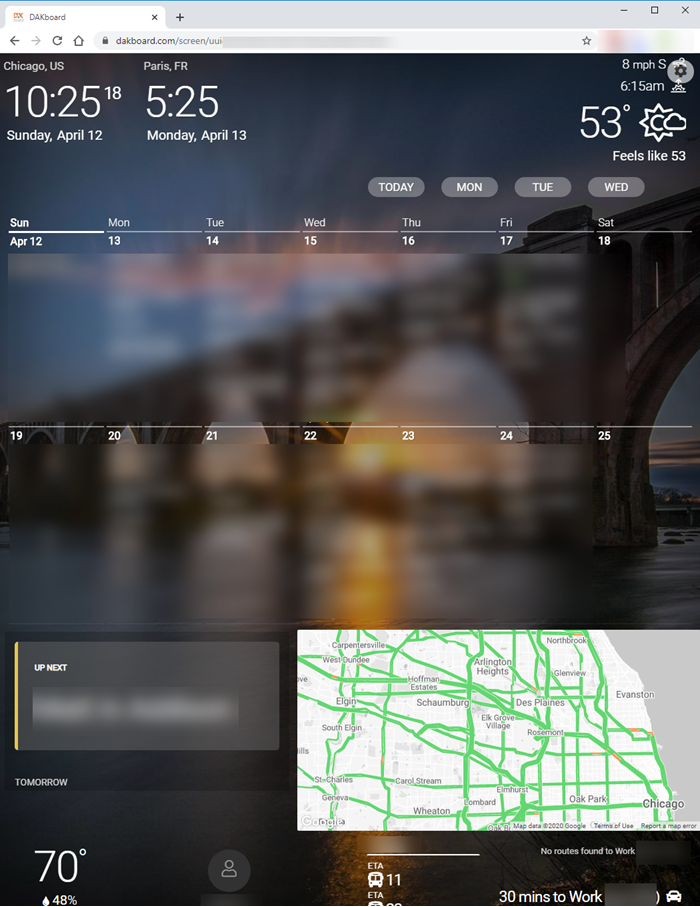
https://www.google.com/maps/place/Chicago,+IL/@41.8336479,-87.8720451,11z/
In the above example, you’ll see I’ve searched for Chicago and the URL automatically appends the LAT (left of comma) and LONG (right of comma) for the city center. Keep in mind that these coordinates are generated based on the window you’re viewing and will likely need to be adjusted so that the map is framed correctly for the size of your widget on your dashboard.
I found that using latlong.net was helpful because the map preview was roughly the same size I was using. Simply search your desired location and then click around on the map to have it update the LAT/LONG coordinates. In the code below you’ll need to replace
center: {lat: YOUR_LAT_COOR, lng: YOUR_LONG_COOR}
with your respective LAT/LONG coordinates. You may also find that you need to tweak them a) for the DAKboard preview and b) when you actually get your map on the screen as the preview doesn’t provide a perfect representation of what your map will look like on the full dashboard.
6 - Add a “Widget” Block to your Dashboard
Head back to the correct screen you want to add the map to on the DAKboard site and add a new block. Search HTML or Widget in the search bar and select the Widget block which allows you to render HTML and JavaScript on your board.
7 - Get the Code
DISCLAIMER: I am not a developer or computer scientist. There will be errors and a lack of best practices in what I share here. Feel free to get in touch with any insight and I’ll update my post as needed.
The next step is to add the code to the block. Below is the code I used to successfully get the map on my board. I’d recommend copying this to a text editor like Atom, notedpad++, or similar for easier viewing/editing but that is optional.
<html>
<head>
<style type="text/css">
    #map {
      height: 100%;
    }
/* Optional: Makes the sample page fill the window. */
html, body {
    height: 100%;
    margin: 0;
    padding: 0;
}
</style>

<script type="text/javascript">

    function initMap() {
      var map = new google.maps.Map(document.getElementById('map'), {

        /* 1: World, 5: Landmass/continent, 10: City, 15: Streets, 20: Buildings */
        zoom: 9,

        /* LAT: higher number shifts center upward */
        /* LONG: Higher number shifts center to left */
        center: {lat: YOUR_LAT_COOR, lng: YOUR_LONG_COOR},

        /* This disables controls like zoom in/out */
        disableDefaultUI: true
      });

      var trafficLayer = new google.maps.TrafficLayer();
      trafficLayer.setMap(map);
    }
</script>
</head>
<body>
    <div id="map"></div>
    <!-- Replace the value of the key parameter with your own API key. -->
    <script async defer
    src="https://maps.googleapis.com/maps/api/js?key=YOUR_API_KEY_GOES_HERE&callback=initMap">
    </script>
</body>
</html>
8 - Customize the code to your location and scale
You’ll need to make a few edits to the provided code prior to pasting it into the widget.
1. Add your API key
You’ll need to use the API key you created from the steps above and replace that in the code. In the <body> section of the code snippet, you’ll see this line:
src="https://maps.googleapis.com/maps/api/js?key=YOUR_API_KEY_GOES_HERE&callback=initMap">
Replace the bold YOUR_API_KEY_GOES_HERE with your actual API key.
2. Input your Latitude and Longitude
In the <script type="text/javascript"> section, look for this line:
center: {lat: YOUR_LAT_COOR, lng: YOUR_LONG_COOR}
and replace the placeholders with your respective LAT/LONG coordinates. For LAT: higher number shifts center upward and for LONG: Higher number shifts center to left. You’ll likely only change the number by tenths or maybe even hundredths once you are dialing it in finely.
3. Set your zoom (1-20)
In the code itself, there are some hints about what zoom level results in what scale but generally lower numbers are more zoomed our and higher numbers are more zoomed in. Your desired zoom will depend on a few things including:
Desired level of detail
Geographic area you’re trying to keep in frame
Size of the widget on your dashboard
Resolution of the monitor you’re dashboard is displayed on
I’d recommend starting at a zoom of 10 and adjusting from there. NOTE: the preview is a good approximation of what the map will look like but not perfect. You’ll actually need to actually push the map to your screen to see the proper scale.
4. Controls
The code I provided turns off the zoom, full screen, and other buttons that appear by default. If you’d prefer to have them, you can comment out or delete this line:
disableDefaultUI: true
At this point, you should have a widget that shows you a live updating traffic map on your board.
9 - BONUS: Style Your Map
The code provided above creates a map that looks like the default style of Google Maps. If you’re like me and that clashes with the appearance of your dashboard, you can customize the look of the map! The API documentation provides a dark mode example but there are other ways to achieve a TON of different looks.
I’d recommend starting with Google’s own map styling tool where you can choose from six presets or dive into the advanced functions to create your own look. Once you hit finish you’ll want to select all the JSON the tool outputs and copy that.
You’ll need to add a style section to your code. I’d recommend adding the following just below the disableDefaultUI: true line in the code provided:
styles: [JSON STYLING CODE GOES HERE
]
If you are going to add your own styling, make sure to add a comment after true in the disableDefaultUI: true line.
If you don’t want to fiddle with Google’s tool, you can browse user-generated map styles from Snazzy Maps. You can copy the same JSON and paste it in the same spot to apply the styles you desire. You can even use the tool to create your own style.
It’s worth noting that with any of these methods, the has more detail than you’ll likely need (e.g. it provides styling to elements you don’t care about). Feel free to leave them or remove them if you want your code to be a bit tidier.